Dr. Johannes Fuchs
Projects
Systematic Review of Experimental Studies on Data Glyphs
We systematically reviewed 64 user-study papers on data glyphs to help researchers and practitioners gain an informed understanding of tradeoffs in the glyph design space. The glyphs we consider are individual representations of multi-dimensional data points, often meant to be shown in small-multiple settings. Over the past 60 years many different glyph designs were proposed and many of these designs have been subjected to perceptual or comparative evaluations. Yet, a systematic overview of the types of glyphs and design variations tested, the tasks under which they were analyzed, or even the study goals and results does not yet exist. In this paper we provide such an overview by systematically sampling and tabulating the literature on data glyph studies, listing their designs, questions, data, and tasks. In addition we present a concise overview of the types of glyphs and their design characteristics analyzed by researchers in the past, and a synthesis of the study results. Based on our meta analysis of all results we further contribute a set of design implications and a discussion on open research directions.
Evaluation of Alternative Glyph Designs for Time Series Data
(received an Honorable Mention Award at CHI 2013)
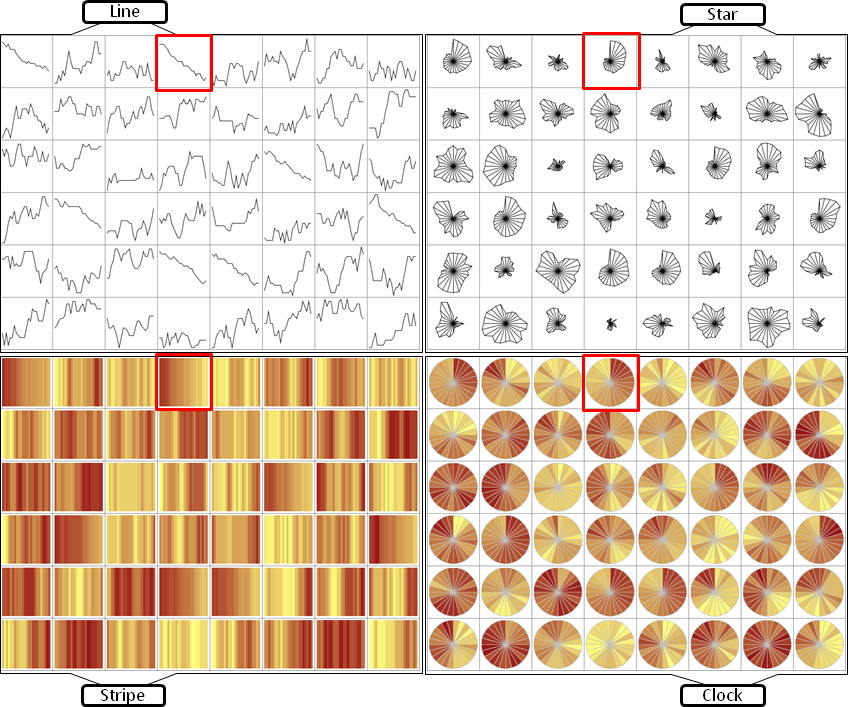
Time series data is the basis for decision making in many different application domains - such as finance, network security, or traffic management. Detecting trends, spotting peaks, or investigating single points in time from a visual representation are daily analysis tasks of vital importance. Yet, due to glyphs' power in presenting multiple time series for comparison, a multitude of designs have been proposed. Different visual variables such as length, color, or position can be used to encode two aspects of temporal data in one glyph: a) the location of a data point in time, and b) the quantitative data value. When confronted with the task of choosing an appropriate glyph design, a visualization designer or practitioner currently has little guidance on which encodings would be most appropriate for which tasks and on which visual features and factors influence people's perception of data encoded in glyphs. In order to address this lack of guidance on the use of temporal glyphs, we ran a controlled experiment to compare four carefully selected glyphs using two different data densities.
Evaluation of Alternative Glyph Designs for Multi Dimensional Data
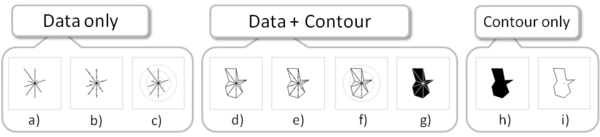
We conducted three experiments to investigate the effects of contours on the detection of data similarity with star glyph variations. A star glyph is a small, compact, data graphic that represents a multi-dimensional data point. Star glyphs are often used in small-multiple settings, to represent data points in tables, on maps, or as overlays on other types of data graphics. In these settings, an important task is the visual comparison of the data points encoded in the star glyph, for example to find other similar data points or outliers. We hypothesized that for data comparisons, the overall shape of a star glyph - enhanced through contour lines - would aid the viewer in making accurate similarity judgments. To test this hypothesis, we conducted three experiments. In our first experiment, we explored how the use of contours influenced how visualization experts and trained novices chose glyphs with similar data values.
Our results showed that glyphs without contours make the detection of data similarity easier. Given these results, we conducted a second study to understand intuitive notions of similarity. Star glyphs without contours most intuitively supported the detection of data similarity. In a third experiment, we tested the effect of star glyph reference structures (i.e., tickmarks and gridlines) on the detection of similarity. Surprisingly, our results show that adding reference structures does improve the correctness of similarity judgments for star glyphs with contours, but not for the standard star glyph.
As a result of these experiments, we conclude that the simple star glyph without contours performs best under several criteria, reinforcing its practice and popularity in the literature. Contours seem to enhance the detection of other types of similarity, e.g., shape similarity and are distracting when data similarity has to be judged. Based on these findings we provide design considerations regarding the use of contours and reference structures on star glyphs.