Subspace Clustering
Steerable Subspace Clustering for Visual Analytics
The main goal of this project is the tight integration of visual analytics into the process of subspace cluster generation and analysis.
Interesting patterns may be located in subspaces of a large input feature space.
While a rich body of research has been carried out in designing subspace clustering algorithms, surprisingly little attention has been paid to develop effective visualization tools to help analyzing the clustering result. Appropriate visualization techniques could not only help in monitoring the clustering process but,
they also enable the domain expert to guide and even to steer the subspace clustering process to reveal the patterns of interest. To this goal we envision a concept that combines scalable subspace clustering algorithms and interactive scalable visual exploration techniques. This work will include the task of comparative visualization and feedback guided computation of multiple alternative clusterings.
In the following we enumerate a number of systems that deal with this problems:
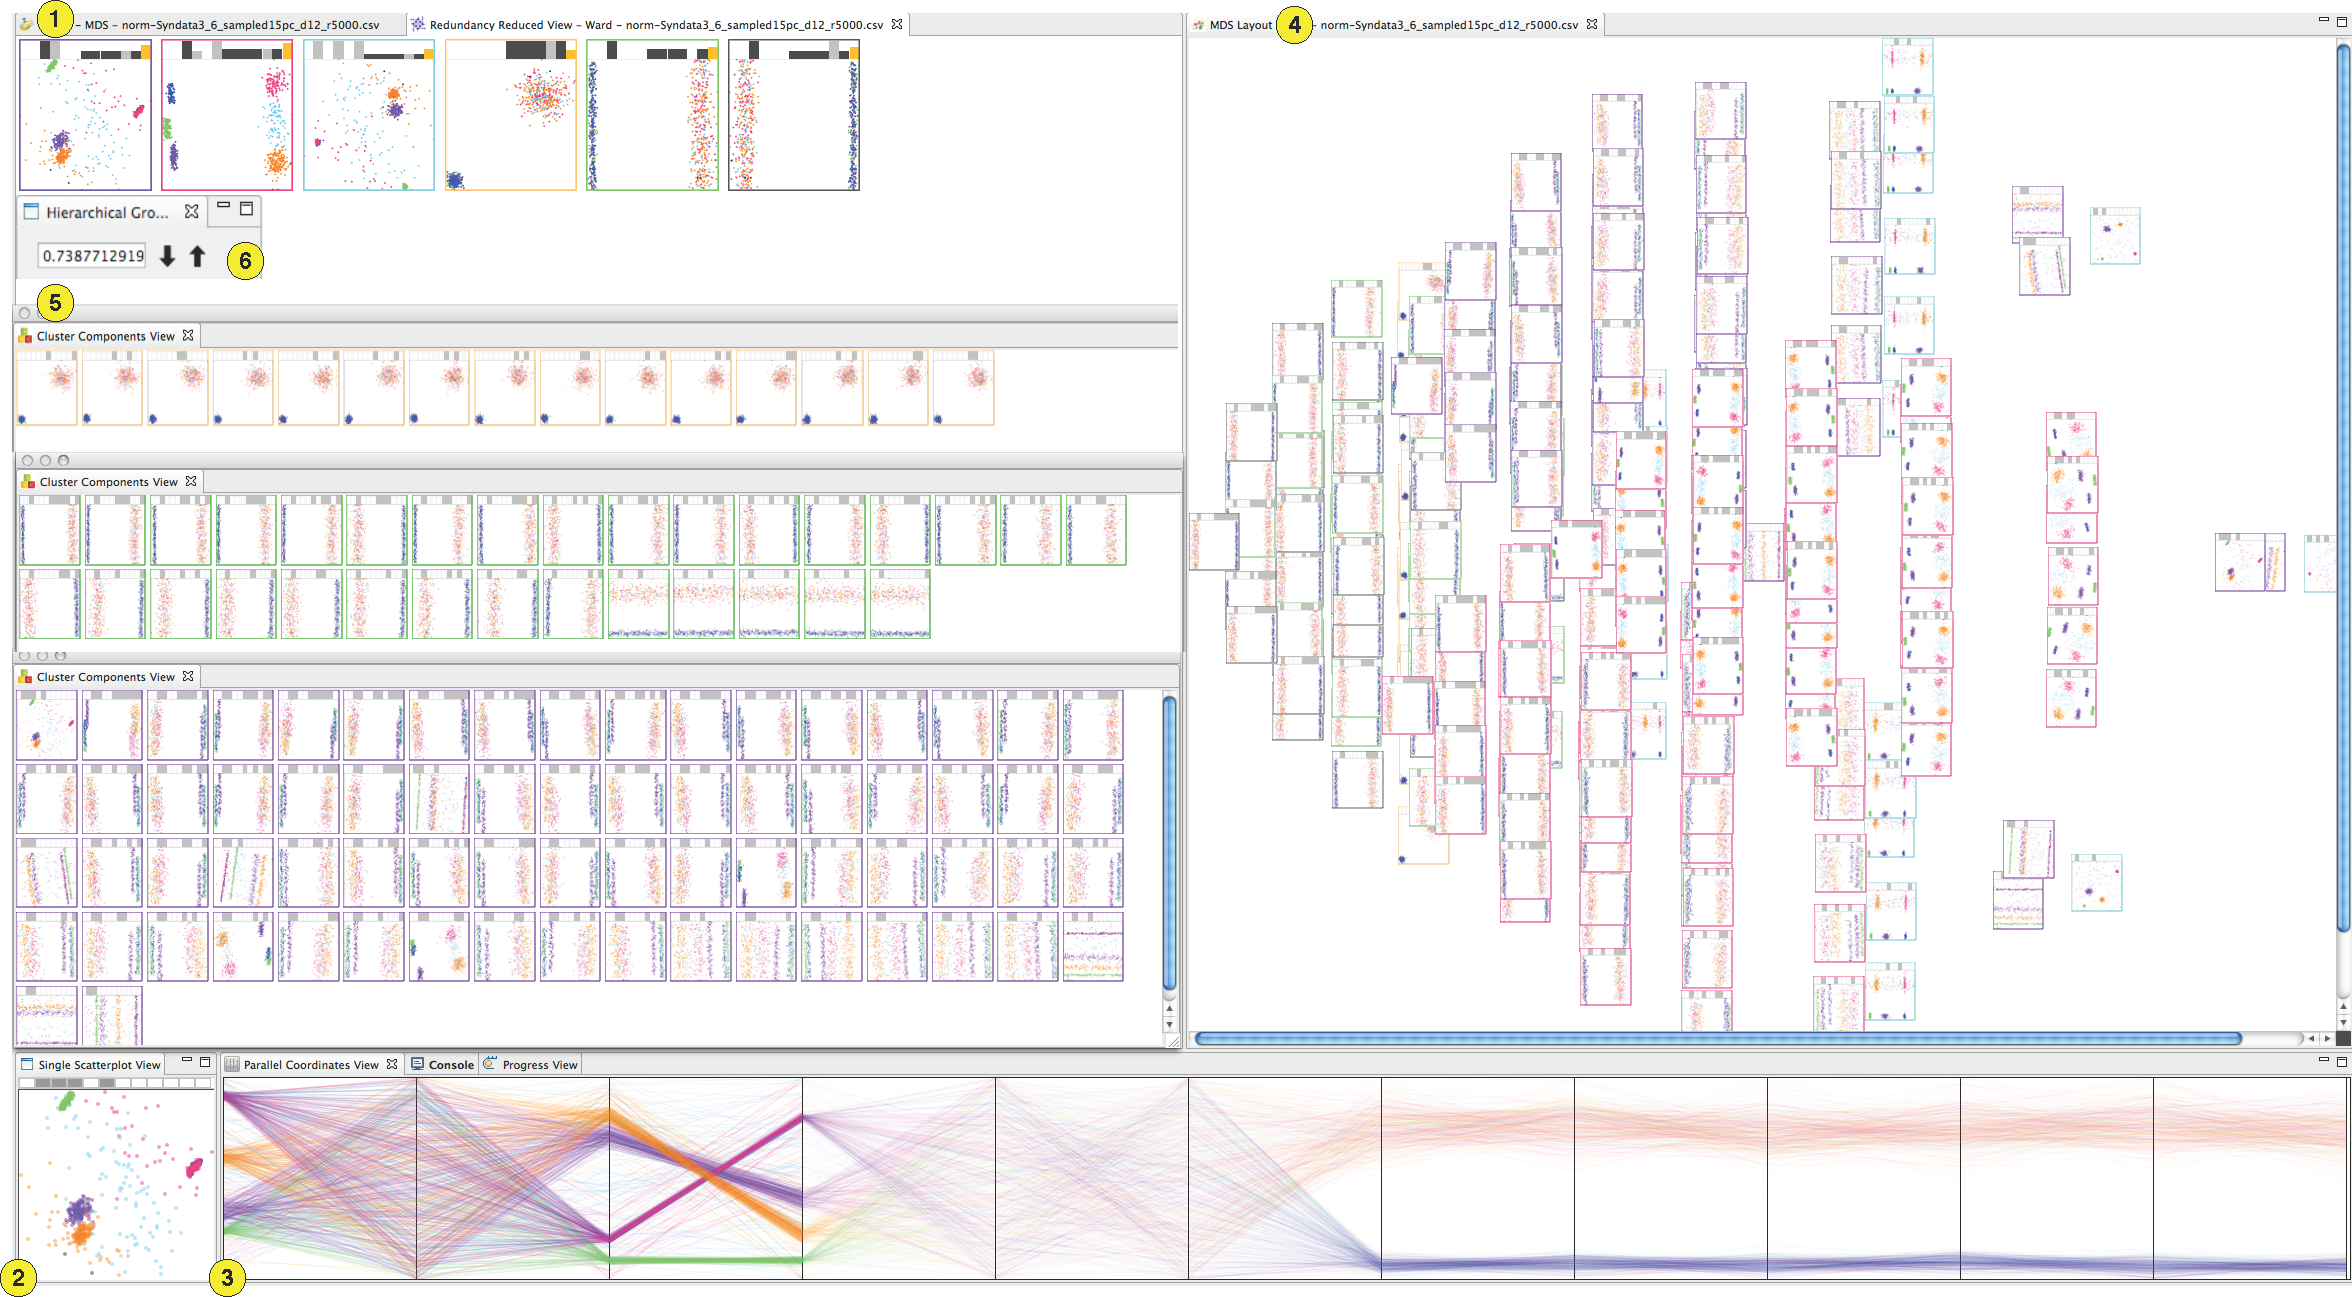
Subspace Search and Visualization to Make Sense of Alternative Clusterings in High-Dimensional Data
A systematic methodology for visual analysis of high-dimensional data where an interestingness-guided subspace search algorithm detects interesting subspaces. Based on appropriately defined subspace similarity functions, we visualize the subspaces and provide navigation facilities to interactively explore large sets of subspaces. Our approach allows users to effectively compare and relate subspaces with respect to the involved dimensions and clusters of objects.
ClustNails: Visual Analysis of Subspace Clusters
Subspace clustering addresses an important problem in clustering multidimensional data. In sparse multidimensional data, many dimensions are irrelevant and obscure the cluster boundaries. Subspace clustering helps by mining the clusters present in only locally relevant subsets of dimensions. However, understanding the result of subspace clustering by analysts is not trivial. In addition to the grouping information, relevant sets of dimensions and overlaps between groups, both in terms of dimensions and records, need to be analyzed.
We present an interactive visualization system called ClustNails to analyze, navigate, relate, and understand subspace clustering results.

More information about this and related work can be found in the following publications.