Quantification of Visual Analytics Transformations and Mappings
This project is part of the Collaborative Research Center SFB-TRR 161 "Quantitative Methods for Visual Computing"
High-dimensional data analysis requires dealing with numerous challenges, such as selecting meaningful dimensions, finding relevant projections, and removing noise. As a result, the extraction of relevant and meaningful information from high-dimensional data is a difficult problem. This project aims at advancing the field of quality-metric-driven data visualization with the central research question of how to quantify the quality of transformations and mappings of high-dimensional data for visual analytics.
Research Questions
- How can we measure and quantify the quality of a visualization? In which way do methods in the data space differ from methods in the image space?
- How can we compare the measured quality of a visualization with the perception of a human?
- How can the user be involved into a quality-metric-driven process of visual mappings and transformations?
- What is the influence of perceptual effects on quality measures?
- Can we enhance the visual representation of information by introducing perceptual effects into visualizations?
Selected Results
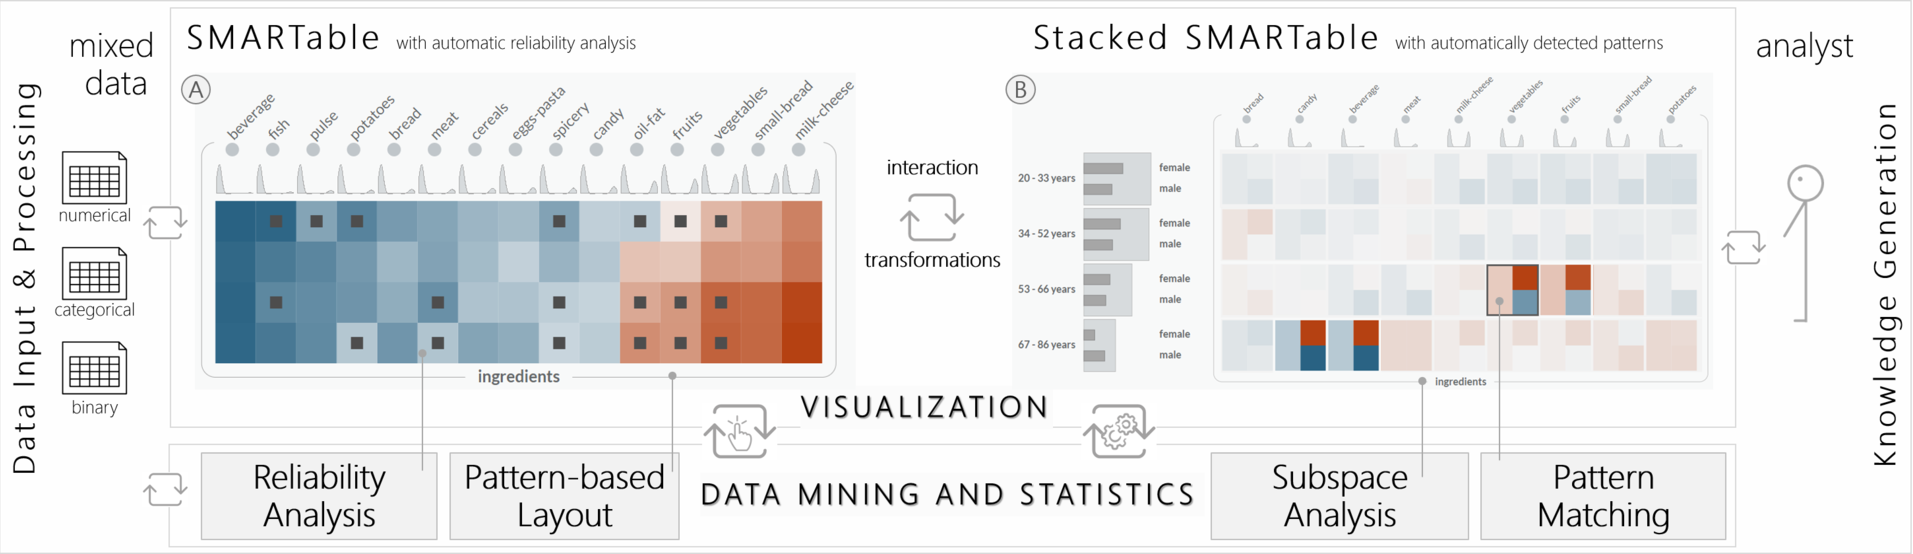
SMARTexplore: A novel, table-based Visual Analytics approach to identify and understand clusters, correlations, and complex patterns in high-dimensional data. We use quality metrics for a semi-automatic reliability analysis and a pattern-based layout of rows and columns. Pattern matching and subspace analysis algorithms are used to reveal interesting findings. Try it out here.