Visualization Tools for Network Attacks
Temporal MDS Plots for Analysis of Multivariate Data
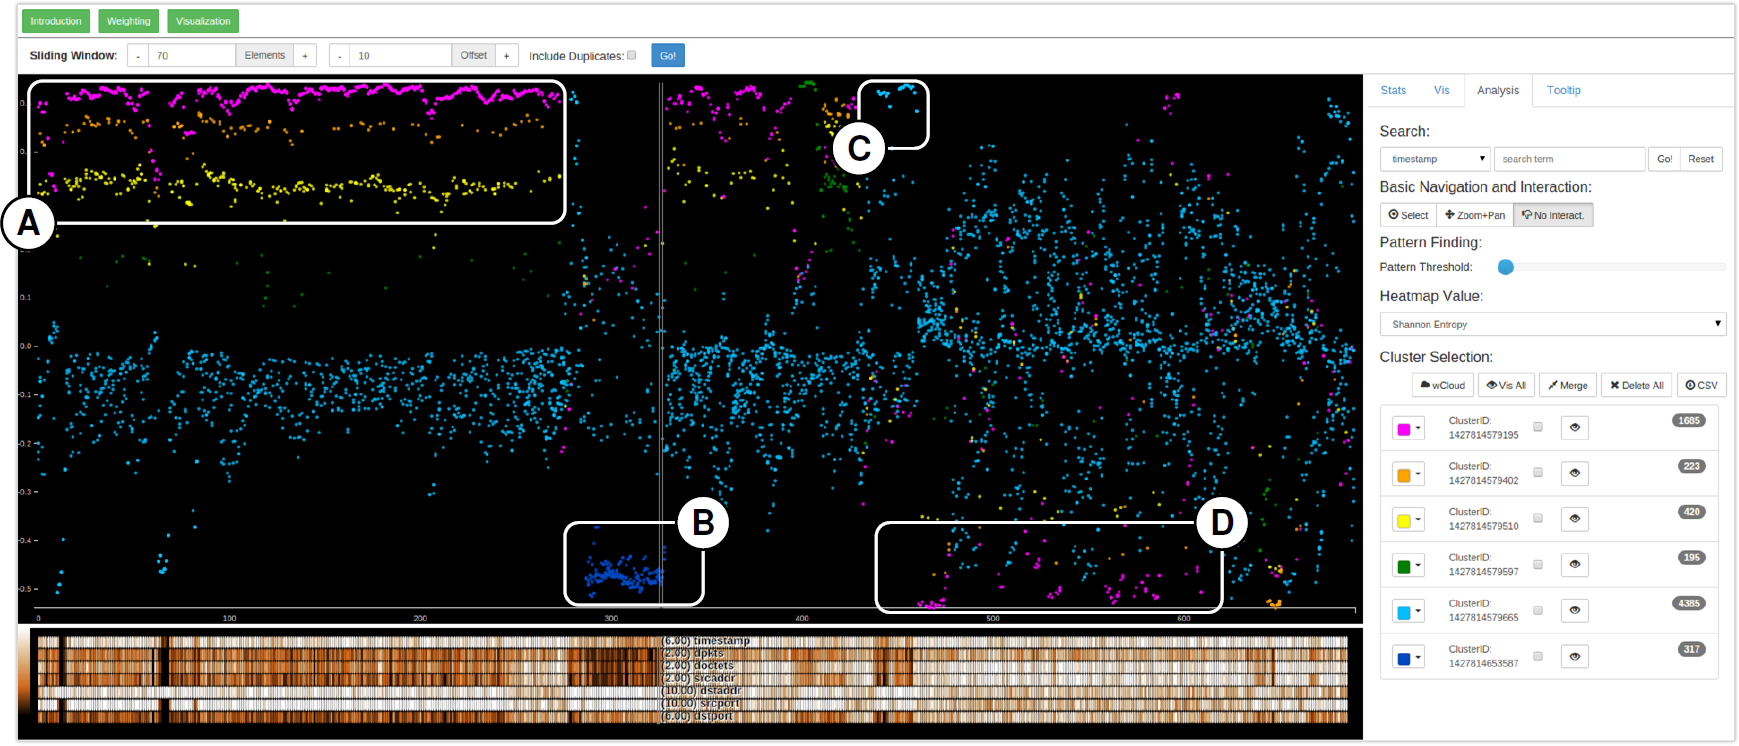
Multivariate time series data can be found in many application domains. Examples include data from computer networks, healthcare, social networks, or financial markets. Often, patterns in such data evolve over time among multiple dimensions and are hard to detect. Dimensionality reduction methods such as PCA and MDS allow analysis and visualization of multivariate data, but per se do not provide means to explore multivariate patterns over time. We propose Temporal Multidimensional Scaling (TMDS), a novel visualization technique that computes temporal one-dimensional MDS plots for multivariate data which evolve over time. Using a sliding window approach, MDS is computed for each data window separately, and the results are plotted sequentially along the time axis, taking care of plot alignment. Our TMDS plots enable visual identification of patterns based on multidimensional similarity of the data evolving over time. We demonstrate the usefulness of our approach in the field of network security and show in two case studies how users can iteratively explore the data to identify previously unknown, temporally evolving patterns.
Large-Scale Network Monitoring for Visual Analysis of Attacks
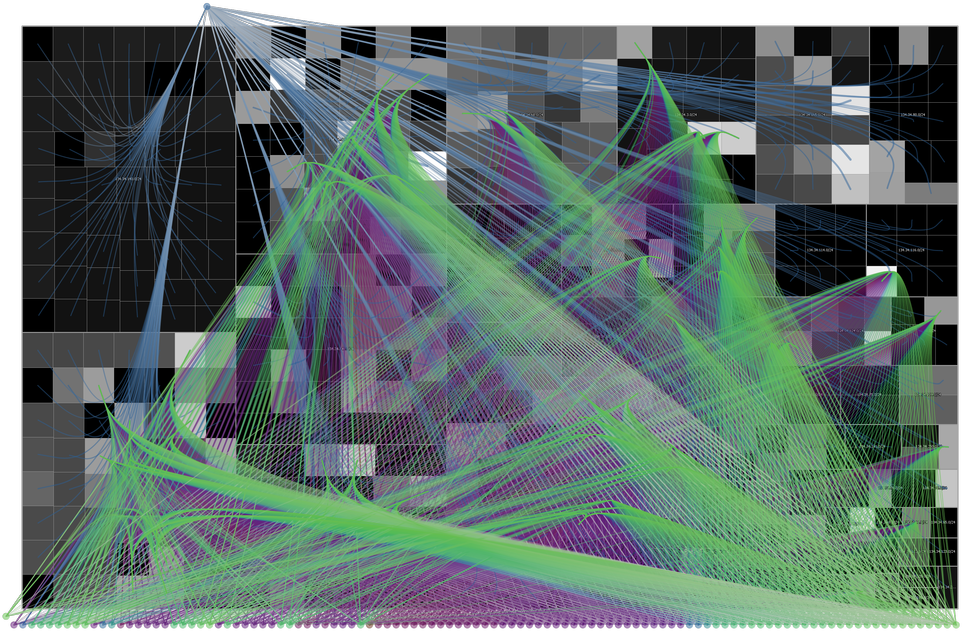
NFlowVis is a system built in 2008 to analyze NetFlow data using a relational database system. NetFlow records are linked with alerts from an intrusion detection system to enable efficient exploration of suspicious activity within the monitored network. Within the system, the monitored network is mapped to a treemap visualization, the attackers are arranged at the borders and linked using splines parametrized with prefix information.
More information about NFlowVis and related work can be found in the following publications.