Quality Metrics
Quality Metrics for High-Dimensional Data Visualizations
Visual exploration of multivariate data typically requires projection onto lower-dimensional representations. The number of possible representations grows rapidly with the number of dimensions, and manual exploration quickly becomes ineffective or even unfeasible. Visual quality measures have been recently devised to automatically extract interesting visual projections out of a large number of available candidates. The measures permit for instance to search within a large set of scatter plots (e.g., in a scatter plot matrix) and select the views that contain the best separation among clusters. Using quality measures, the user is provided with a manageable number of potentially useful candidate visualizations, which can effectively ease the task of finding truly useful visualizations and speed up the data exploration task. We developed measures for class-based as well as non class-based scatter plots and parallel coordinates visualizations (TVCG ’11). We also provide an overview of approaches that use quality metrics in high-dimensional data visualization and propose a systematization based on a thorough literature review (InfoVis ’11).
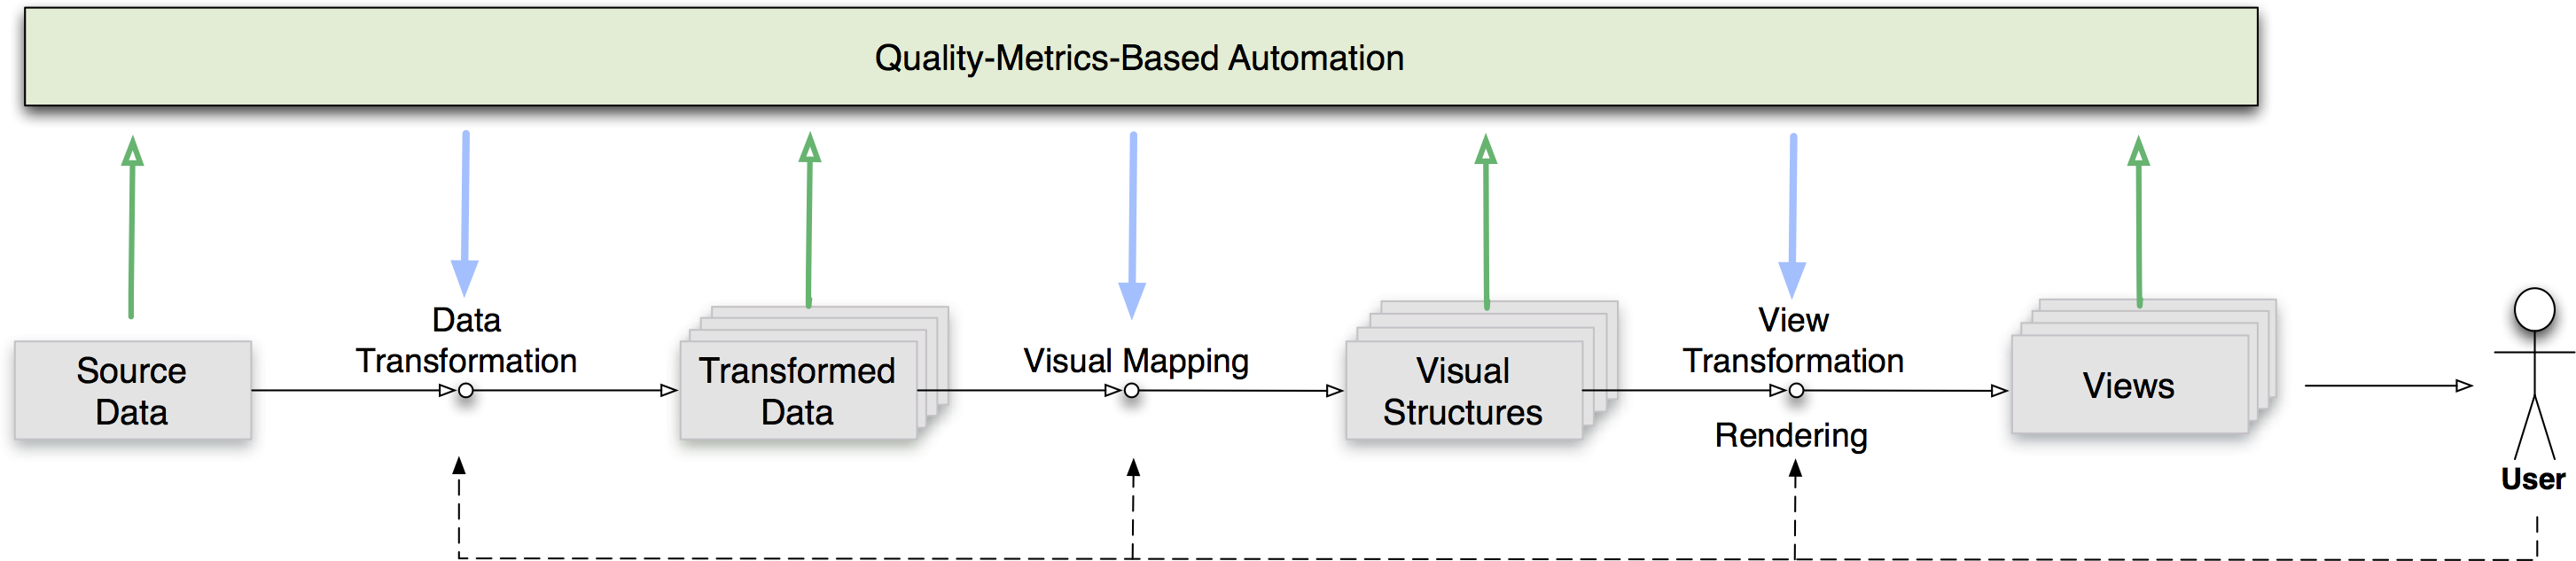
Overview and Systematization
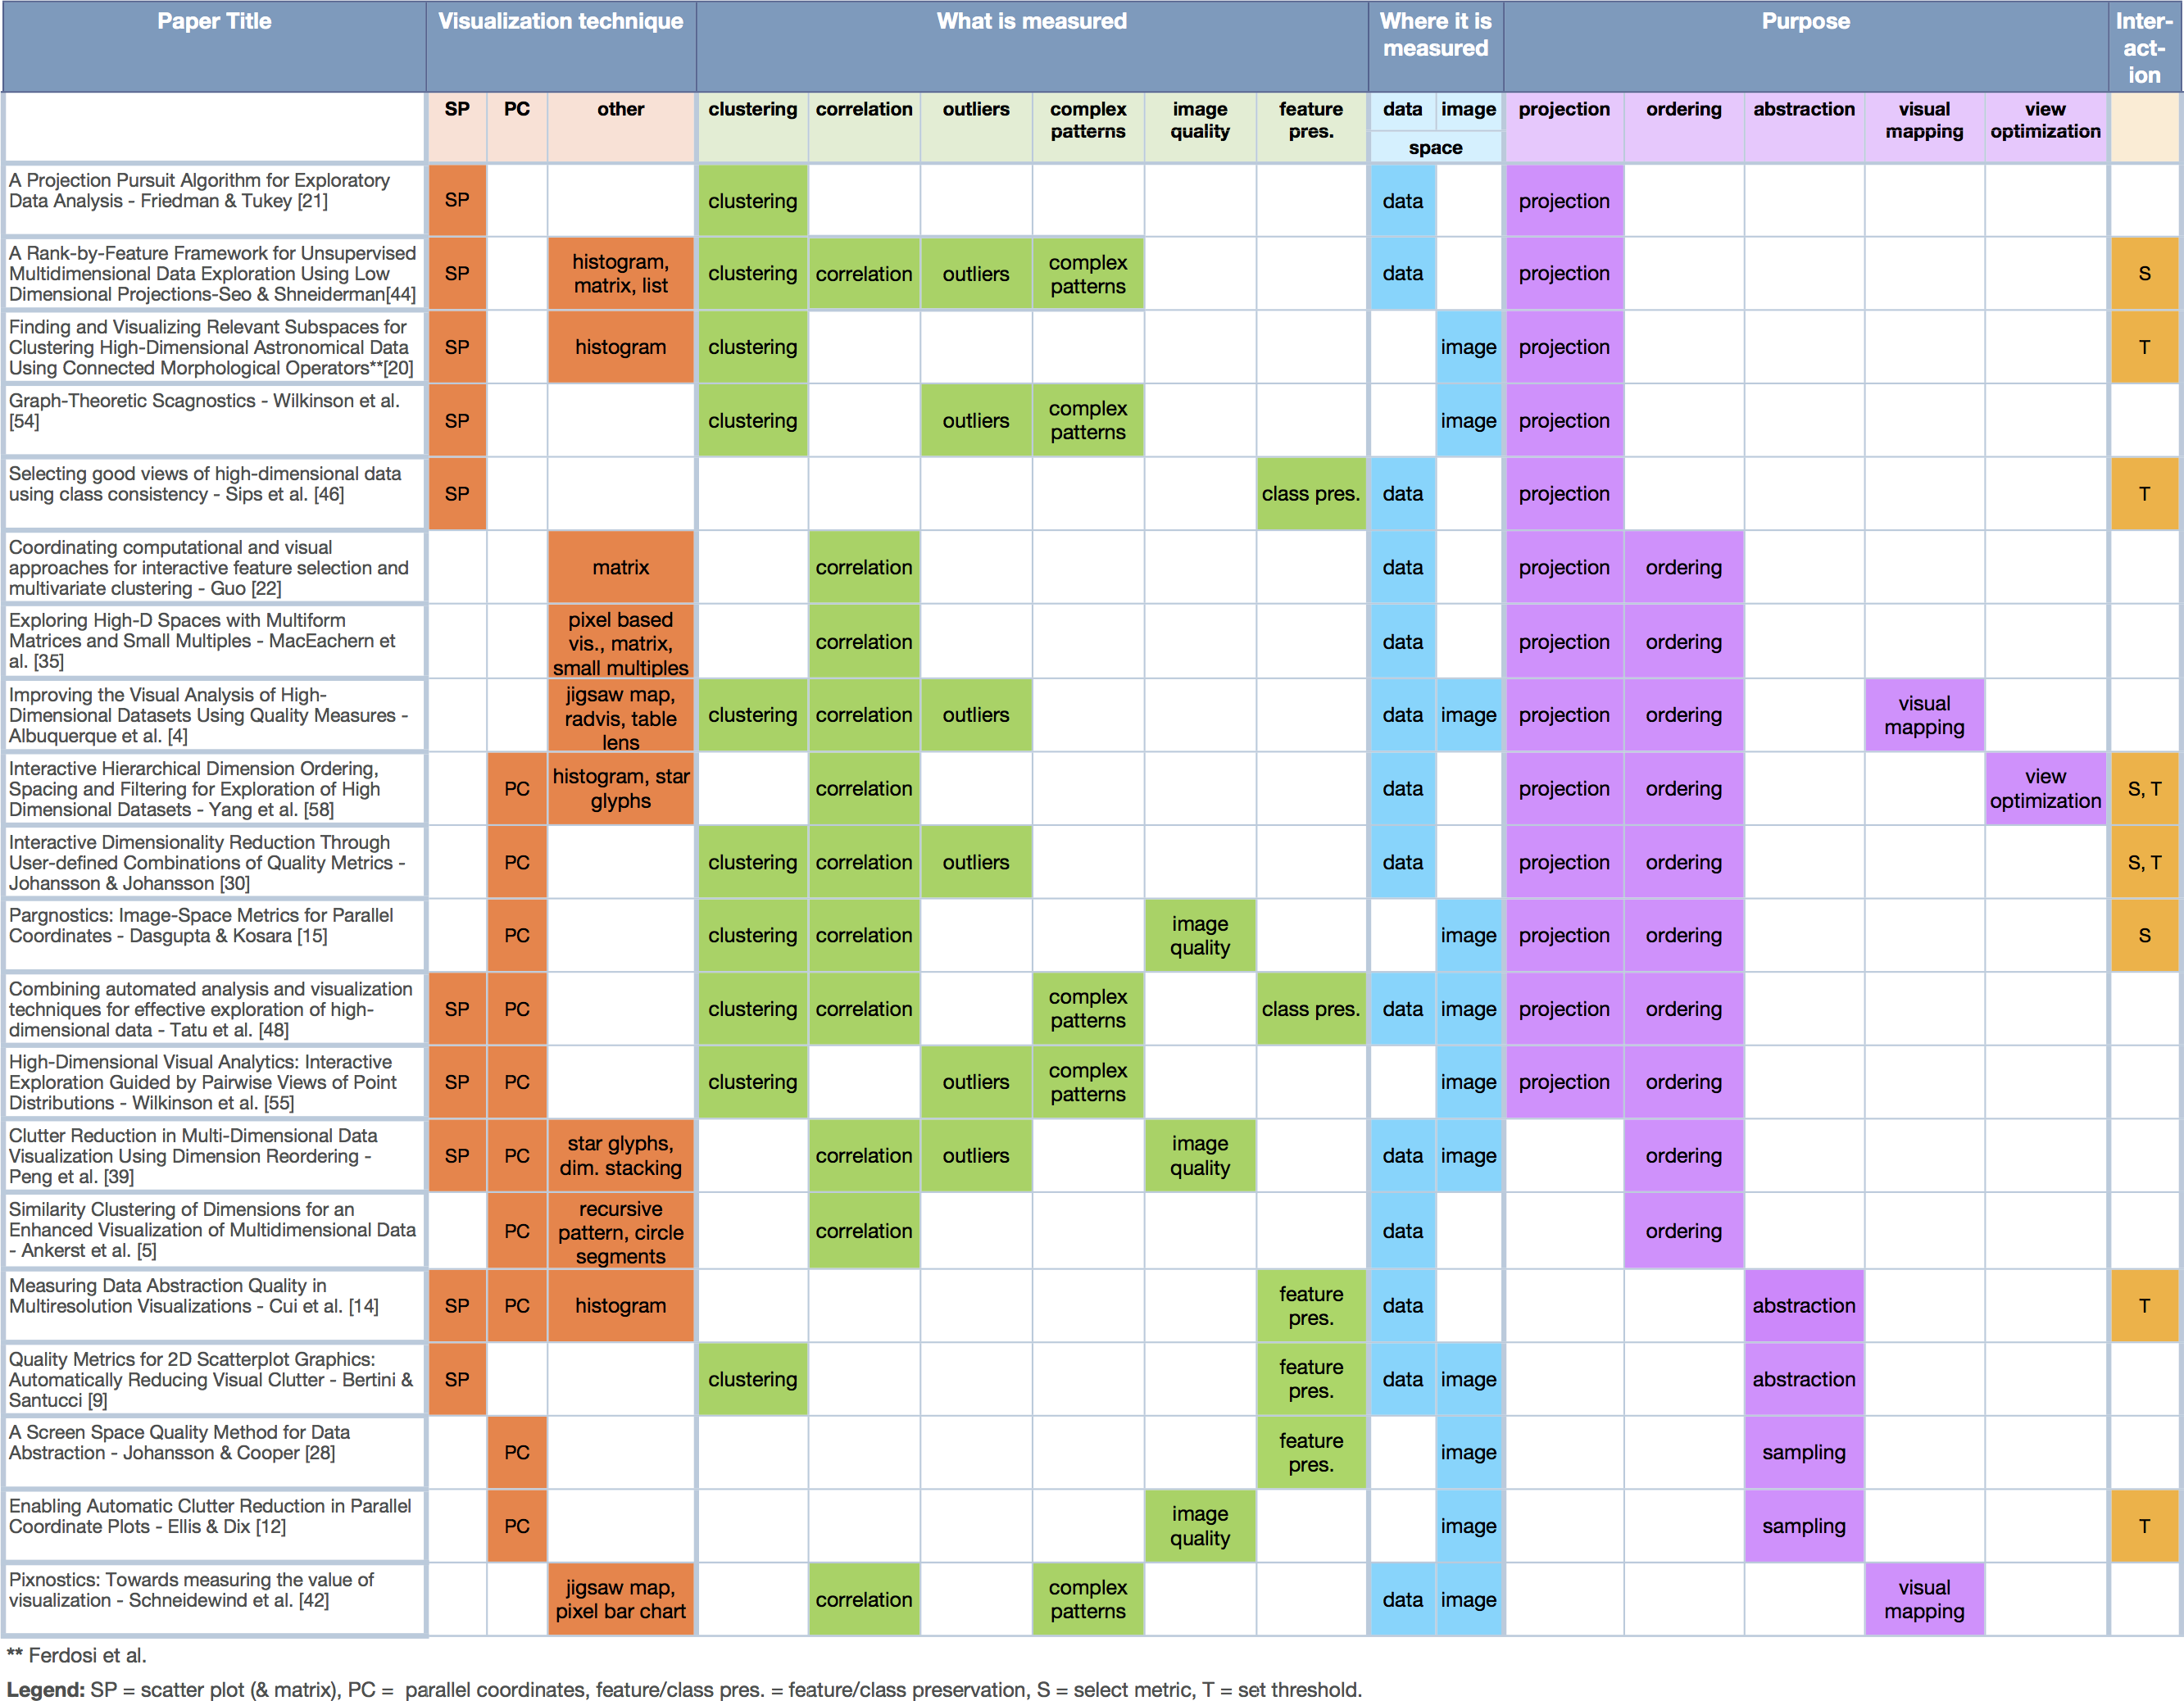
Literature review for quality metrics used in high-dimensional data visualization leading to the definition of a number of factors that characterize this works and a quality metrics pipeline.
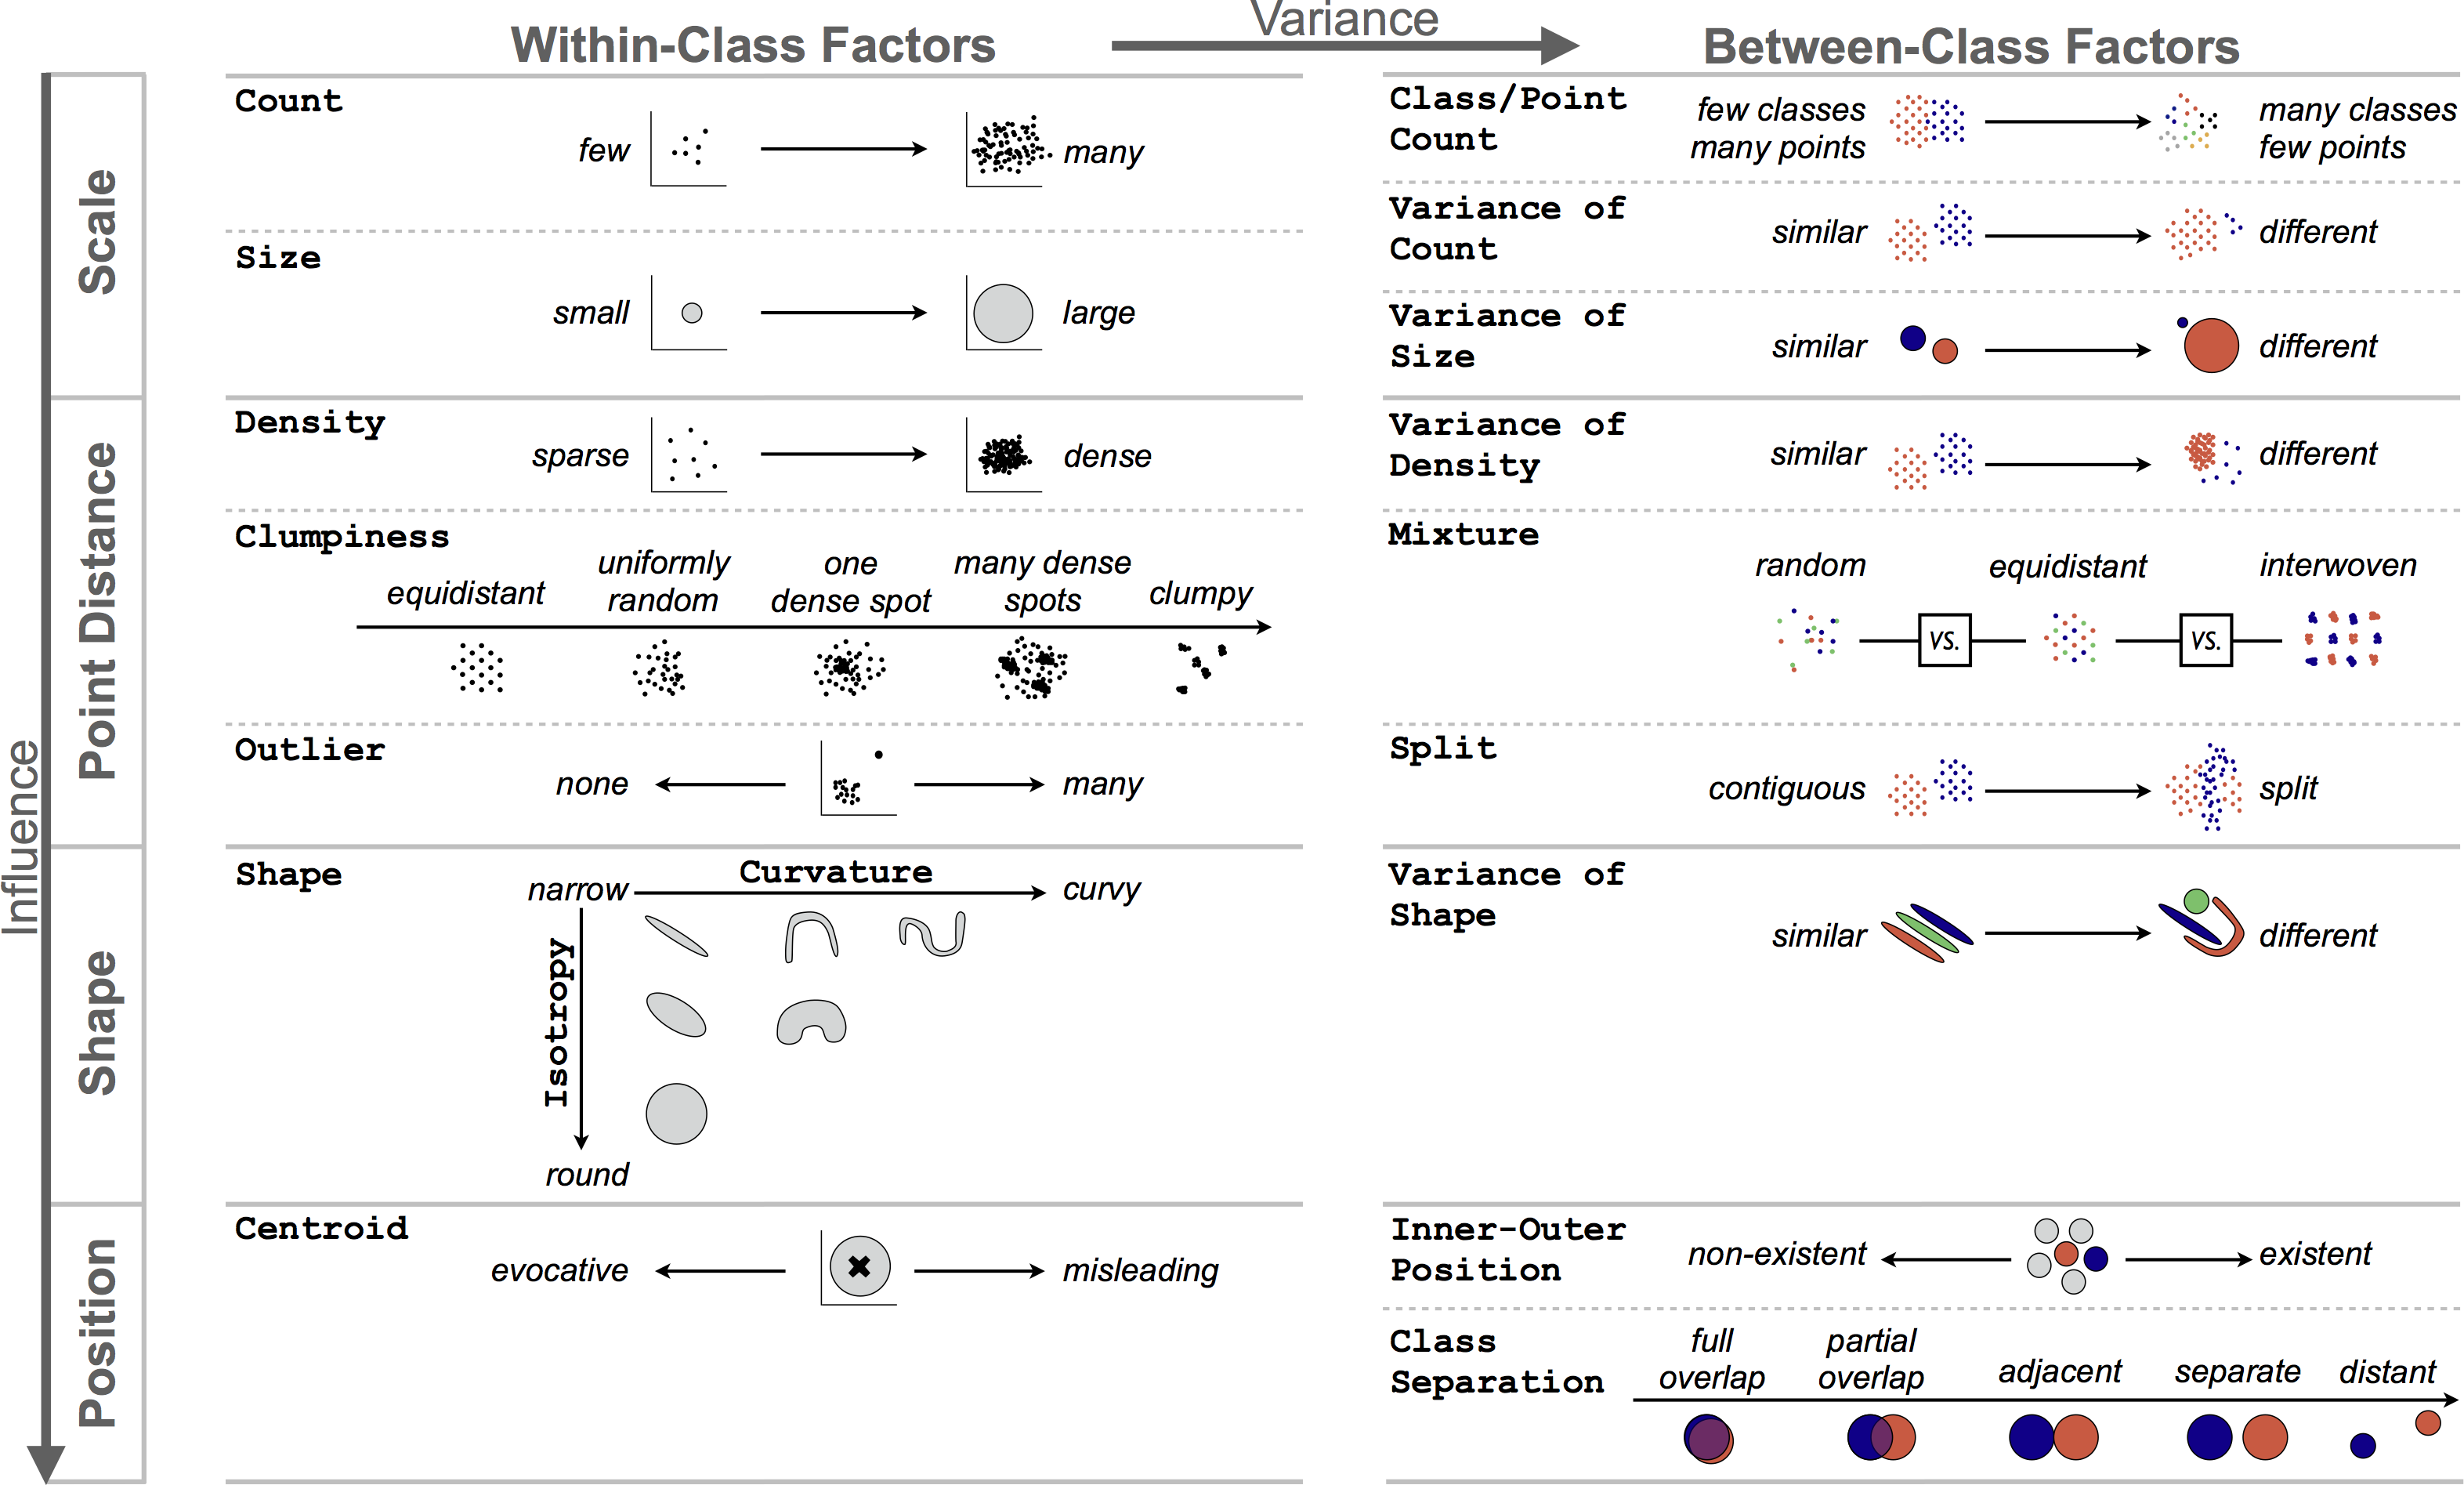
A Taxonomy on Visual Cluster Separation Factors
Qualitative evaluation of 816 plots, including analysis of the reasons for failure of previous cluster separation metrics and a taxonomy of factors that affect separation.
More information about this and related work can be found in the following publications.