Event Detection in Document Streams
Exploration of Temporal Events in Document Streams
Data streams with textual content can come from different channels, such as online news websites, Twitter, or blogging platforms. These channels exhibit complex characteristics that differentiate them in volume, speed, and the quality of the information they provide. The research challenges lie on the cross-section of text mining, time-series analysis and visual analytics. In our group, we are focusing on the real-time and incremental methods for exploration of events, temporal dynamics of online news streams, and their relations to other types of data streams, such as stock market data.
Visual Analytics of News Story Development
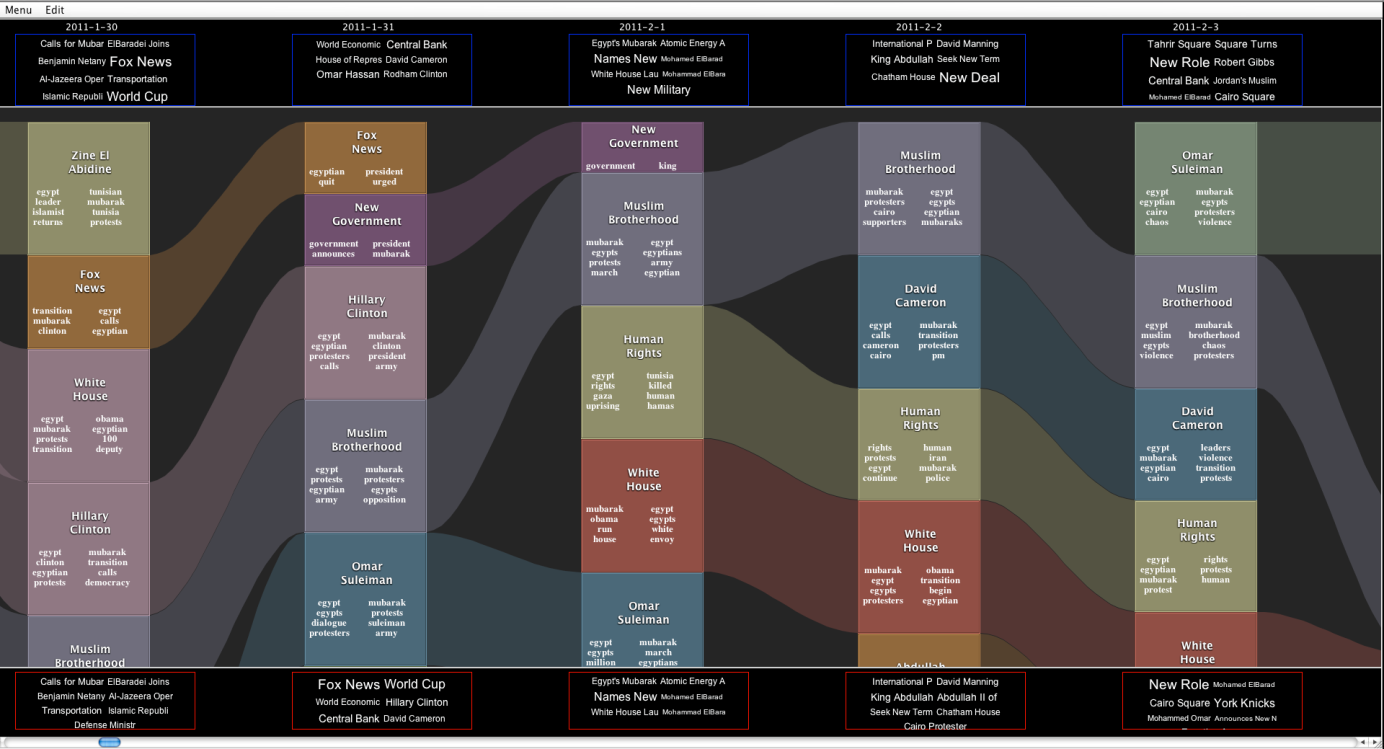
News sources produce thousands of news articles every day, reporting on local and global real-world events. This vast amount of data can help the readers to make better sense of the world in which they live in. However, new information from today quickly replaces the old reports from yesterday, and understanding the story development can become a difficult task.
We have developed a visual exploration system that helps the reader in getting a better insight into news story development and its content. The system provides user-specific temporal overviews with different levels of detail with highly customizable filtering and sorting options. News articles, which are collected from a large number of media portals, news agencies and government institution websites, are grouped into coherent topics using automated algorithms for document clustering. The topics are presented to the user with an incremental interactive visualization method that can display and process new information without recalculating the past data and changing the visual layout.
Detection and Exploration of Event Episodes in Text Streams
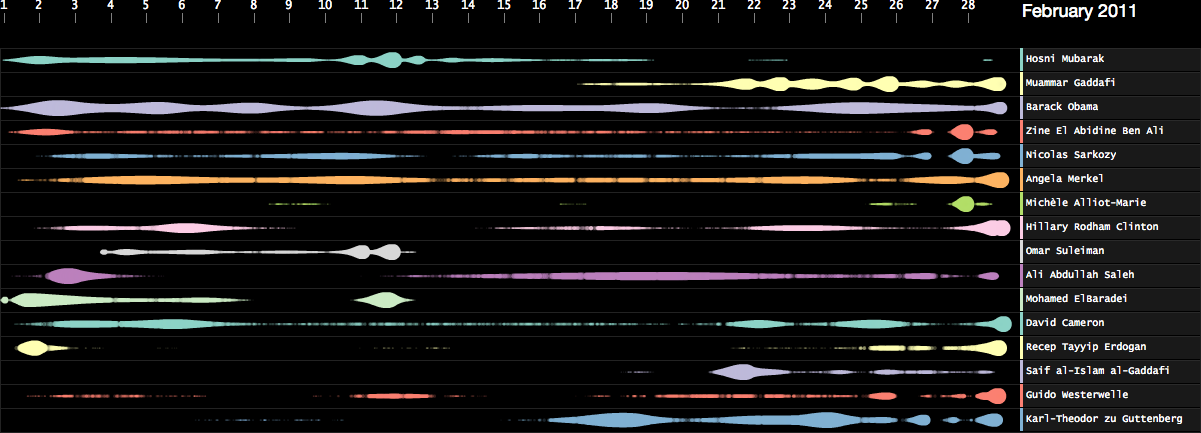
When exploring time-stamped data that arrives in data streams, the analysts are usually looking for event episodes, i.e. interesting sequences of data points that are similar in some way. An event episode can be, for example, a news story consisting of news articles that come in a news text stream at irregular time intervals, and report on the same real-world topic. In such application scenarios, it is very often necessary to be able to access individual data points (i.e. events), while keeping an overview of the dataset within a wider time frame. Common methods for displaying temporal data employ aggregation or sampling of data points to reduce clutter and provide information about temporal trends in the dataset, thus making the analysis of data on atomic level difficult.
We have developed CloudLines, an interactive visualization method, which combines density estimation with truncation functions and lens distortion and magnification techniques to make exploration of interesting event patterns possible at any scale. The density estimators are used together with importance functions to enhance high-density regions and reduce low-density regions, creating fine-textured temporal fingerprints of underlying data. The method can be coupled with time-series algorithms to automatically detect pre-defined event episodes of interest and perform automated similarity comparison across multiple time series.
More information about this and related work can be found in the following publications.